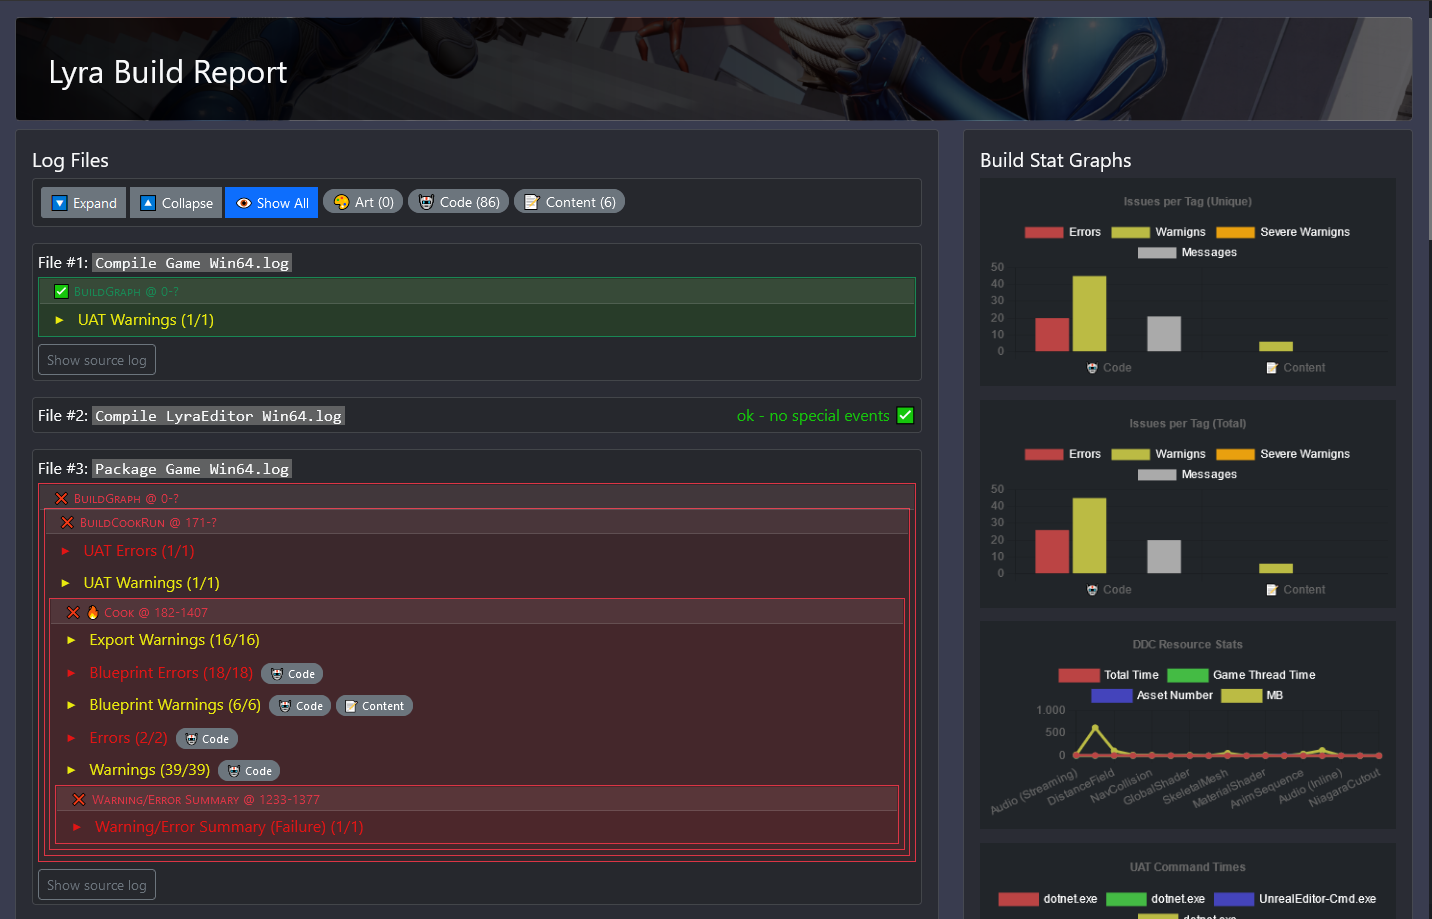
HTML Build Reports
ℹ️ This article is based on my experience working at Grimlore Games. All of the code referenced in this article is freely available as part of my Open Unreal Automation Tools.
⚠️ I’m assuming high-level familiarity with the Unreal Engine build pipeline and Python.
Motivation
Game builds usually produce a myriad of log files and diagnostics that very quickly become undecipherable and impossible to navigate. For our UE5 game builds at Grimlore Games we quickly decided that we would want to have some high-level HTML reports that we could distribute in the team, and which should provide a frequent overview of the latest build status of the project.
I started out with a pretty simple log parser that would extract errors from our build logs, but the reports quickly grew to encompass more metadata and additional optionally embeddable reports.
ℹ️ Please refer to this LyraBuildReport generated from Epic’s Lyra project as an example.
Follow Along
If you want to get a better picture of the results of the report generation, please take a look at the LyraBuildReport I generated for Epic’s Lyra sample project. I will use this project and a very simple BuildGraph script (not the one shipped with Lyra) during this article so you can see the fundamentals of the build and report generation process.
You can also run the build and scripts yourself. You’ll need the following setup:
- Unreal Engine 5.2 installation from Epic Games Launcher
- Lyra Starter Game Sample Project (UE 5.0 version) from Unreal Marketplace with a few code fixes to make it compile in UE 5.2
- Project file must be renamed to Lyra.uproject (my tools always assume the project name matches the project file name, which is also the case for the Perforce version of Lyra)
- All Build.cs files must be adjusted to explicitly use UE 5.2 style include order
- Some minor C++ compilation errors
- Python3 installation
- Clone OpenUnrealAutomationTools into
./OpenUnrealAutomationTools/next to the uproject file (at time of writing I’m at commit #9bab368)- Install python lib and dependencies with InstallPythonPackage.cmd
- For some of the optional embeddable reports:
- InspectCode command line tools for static analysis
- OpenCppCoverage for coverage reports
If you can compile the editor using Visual Studio The build and report were created with this Python script, with the following command line:
Lyra/OpenUnrealAutomationTools/Samples/SampleScriptBuildGraph.py --game-target-name=LyraGameTech Stack
First, I need to give a rough overview of our tech stack and requirements…
At Grimlore we utilize the following build tools: - Unreal build tools (UAT, UBT, BuildGraph, etc) - Python (custom python scripts and the python module from Open Unreal Automation Tools) - TeamCity for build management
Reports are distributed via internal tools (starting out with a Mattermost changelog/issues channel), so we want them to be self-contained without any external image/javascript/css files. Linking to publicly available resources (like some static image files or CDN javascript libs) is okay but avoided.
I considered building the report tooling with existing static site generators (e.g. Pelican) but found most of the available options either too opinionated, not self-contained enough (I don’t like pulling in dozens of third-party packages), or not allowing the generation of fully self-contained HTML files. So, I chose to do all the HTML generation with simple Python string handling, which works reasonably well 90% of the time. So far, keeping everything but the runtime JavaScript code in Python was worth the tradeoff for me.
Log Parsing
The parser is implemented in openunrealautomation.logparse. Using it without custom parameters is incredibly simple:
target_name = "BuildGraph" # This will become important later!

# For a single log file:
parsed_log = parse_log("/path/to/log-directory/log-file.log", "/path/to/log-patterns.xml", target_name)

# For multiple log files in a log directory
parsed_logs = parse_logs("/path/to/log-directory/", "/path/to/log-patterns.xml", target_name)
In the Lyra script example, I used the log directory, because the build was run via my BuildGraph distribution utility, which copies the UAT log for each BuildGraph node after executing each node individually.
The output of either function is a (list of) structured parsed log file object(s), which can be optionally post-processed and then included in an HTML report generation:
report_dir = "/path/to/report-output-directory/"
generate_html_report(None,  # no custom HTML template
    html_report_path=os.path.join(report_dir, "LyraBuildReport.html"),
    log_files=parsed_logs,
    embedded_reports=[],
    out_json_path=os.path.join(report_dir, "LyraBuildReport.json"),
    report_title="Lyra Build Report",
    background_image_uri="https://docs.unrealengine.com/5.0/Images/samples-and-tutorials/sample-games/lyra-game-sample/BannerImage.png",
    filter_tags_and_labels={"ART": "🎨 Art", "CODE": "🤖 Code", "CONTENT": "📝 Content"})
Log files have some hidden structure, but they are not as nice to parse and handle like structured json or XML data. Most Unreal tools do not offer structured logging and the kind of structured data we want is detail info burried in Unreal Editor log messages that are emitted during cook (e.g. what assets are broken, what department should look into this issue, etc).
But luckily, all the UE logs have markers that denote start/end of execution blocks (even if not all have the same format) or add some keywords, like log categories that help structure the log. My parsing code takes a rule file with these markers (by default resources/logparse_patterns.xml) that specifies patterns and markers to look for during parsing.
The first building block of these files are pattern definitions:
<Patterns Name="Material Errors" Tags="Art;Code" Severity="Error">
    <Include Style="Literal">Failed to compile Material</Include>
    <Include Style="Literal">LogMaterial: Error</Include>
    <Include Style="Regex">.ush(.*):  err0r</Include>
</Patterns>
These patterns are assigned a severity (message, warning, error) and some tags that can later be used to filter them (e.g. by department).
These patterns can be grouped into scopes which allows applying some parsing rules only after a certain execution block was entered. E.g. we can easily distinguish log lines from Unreal ensure/crash call stacks because of the stack for UAT log lines:
<Scope Name="Exception Callstack">
    <Start>Error: begin: stack for UAT</Start>
    <End>Error: end: stack for UAT</End>
    <Patterns Name="Callstack" Tags="Code" Severity="Error">
        <Include Style="Regex">.*</Include>
    </Patterns>
</Scope>
Both concepts can be combined to more complex structures with a <Template> and <Include> syntax. At the end of the process, we always get a target node that combines all the patterns (this is the target specified in the parse function in Python!).
<Target Name="BuildGraph">
<Patterns Name="BuildGraph UAT Exit Code" Severity="Message" Hidden="true">
<!-- These are special patterns that tell us if BuildGraph execution succeeeded... -->
<Include SuccessFlags="auto" Style="Literal">AutomationTool exiting with ExitCode=0 (Success)</Include>
<!-- ...or failed -->
<Include FailureFlags="auto" Style="Regex">AutomationTool exiting with ExitCode.*Failure</Include>
<Include FailureFlags="auto" Style="Regex">AutomationTool exiting with ExitCode.*Error</Include>
</Patterns>
<!-- Include templates with scope and pattern definitions for Unreal output, UAT output, etc. -->
<Link Template="BuildCookRun" />
<Link Template="Unreal" />
<Link Template="UAT" />
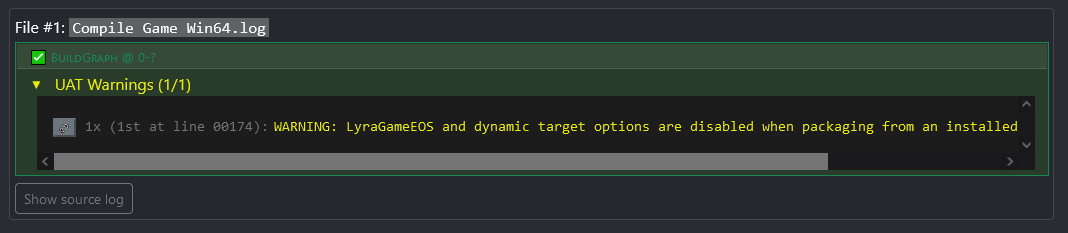
</Target>Note the SuccessFlags and FailureFlags attributes on the Include nodes in the snippet above. Often times we can determine from simple log messages whether a step (or a sub-step / scope) succeeded or failed. E.g. the following section shows that the UAT log file for the “Compile Game Win64” BuildGraph step succeeded with warnings:
However, the package node failed because of some cook errors, including blueprint compile errors:
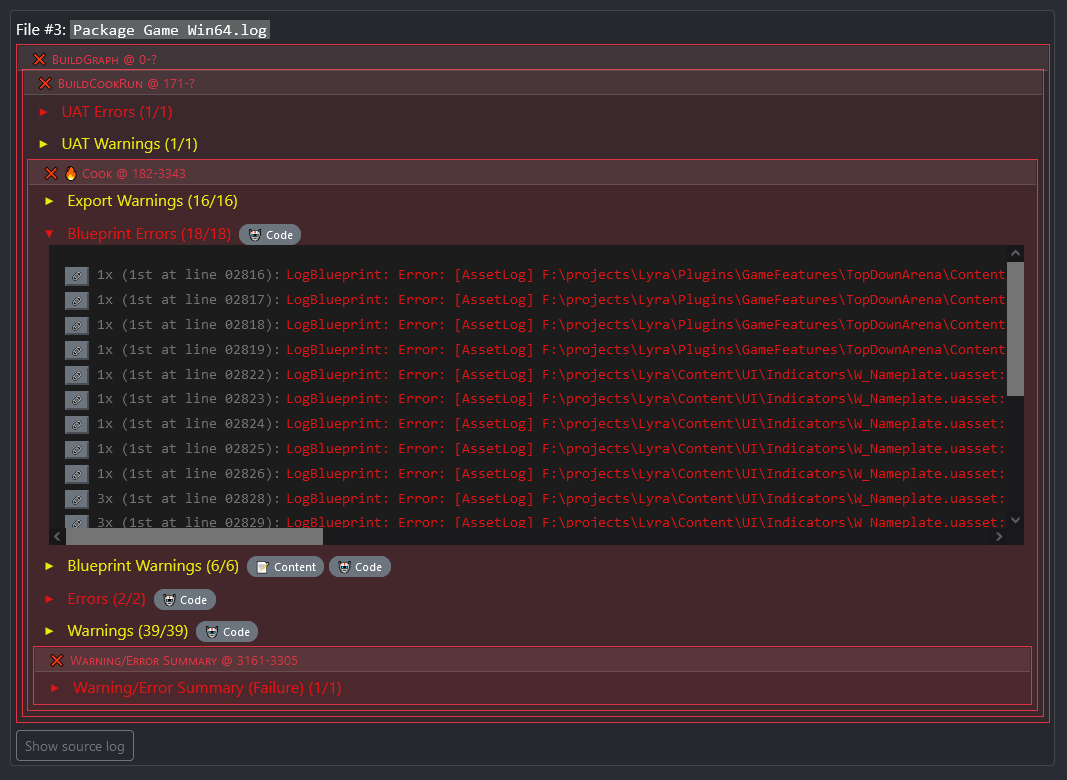
You can see we have nested collapsible sections for all the scopes we declared with lists of matching log lines.
We started out with a single TeamCity log that would be parsed and embedded in its entirety, but that resulted in incredibly big report files and made build parallelization harder than necessary. Now, all log lines in each scope are deduplicated and the report only shows the first occurrence of a message (e.g. if the same asset is referenced multiple times and causes the same error message during cook, it can be filtered out). Clicking on the small chain icon button opens a view of the source log line with a few surrounding lines for context.
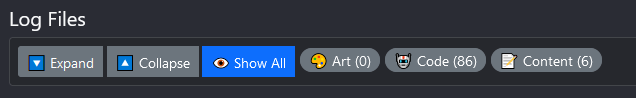
The filter button bar is extensible with custom tags and labels. At Grimlore, we have some post process steps in our Python scripts that attempt to find Perforce users associated with log lines based on asset paths, but this code is not included in the provided script. It boils down to this (with some extra rules):
for line in parsed_log.all_matching_lines():
    if (not line.get_severity() == UnrealLogSeverity.MESSAGE) and ("Developer" not in line.string_vars):
        file_path = find_file_in_line(line)
        if file_path is not None:
            user = ue_p4.get_last_change_user(file_path)
            if user is not None:
                line.string_vars["Developer"] = user
Embedded Reports
In the report generation snippet above you could see that there is an unused parameter for embedded reports. Those are arbitrary HTML string content that will simply be pasted into separate sections in the report HTML file. My build report utilities all use the same JavaScript libs (jquery, chart.js, plotly) and shared styling (bootstrap and some custom css), so they can share some resources.
Optionally embeddable reports provided by my Python module include:
- automation test results
- code coverage from opencppcoverage
- static code analysis via JetBrains inspectcode command line tools
Some of these are very bare bones (e.g. the automation test results only show failed tests), but I keep working on them, because they are already super useful.
The python code required for this is minimal again:
embedded_reports = []
embedded_reports.append(automation_test_html_report(find_last_test_report(ue, report_dir)))
embedded_reports.append(coverage_html_report(find_coverage_file(os.path.join(report_dir, "Coverage"))))
embedded_reports.append(inspectcode.load().html_report(embeddable=True))
These report embeds are an ideal extension point for studio/project specific reporting.
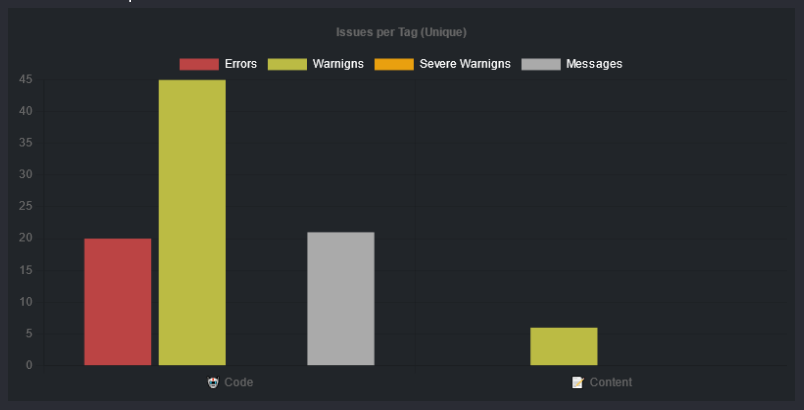
Graphs
Some of the data from logs is automatically displayed as graphs:
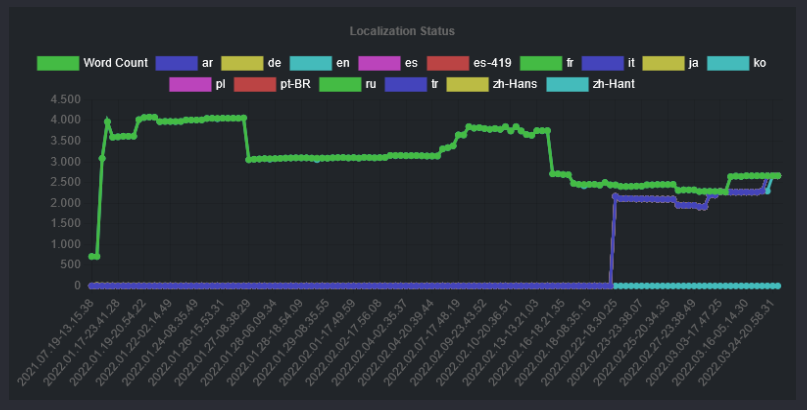
Some other data must be added as via the embedded reports, e.g. this snippet…
embedded_reports.append(create_localization_report(ue.environment, localization_target="Game"))… will add this graph to the report:
Next Steps
None of the information included in the reports is exhaustive so far. But I’m continually trying to strike a balance between generating reports that are concise and give a wide overview of the build status. This means I will probably not add much more in-depth information on code coverage, etc. but rather add more of the high-level information relevant for our build process at Grimlore.
Some of the features I’m considering to include in the future:
- Steam branches (where was this build deployed?)
- Build time metrics (currently only visible in TeamCity)
- Asset information (e.g. simplified size map data?)
- Source control info (new changelists, users, etc.)
- QA status (high-level summary of JIRA / Redmine)
- More inter-build information (i.e. “this changed since last build”)
- Status of the maps / missions / content (e.g. what mission packs are included & marked for QA testing)
- More hyperlinks (e.g. link to other tools like JIRA / Redmine / Steam / etc where possible)
Thanks for reading! 🤗